Showing posts with label bad graphs. Show all posts

Wednesday, February 13, 2013

More fun with charts

Daniel Kuehn and Joseph previously discussed this post by Megan McArdle entitled "Department of Awful Statistics: Income Inequality Edition." They both make good points, but I'd like to approach this from the angle of appropriate visualization. McArdle supports her thesis that the middle class is neither disappearing nor getting poorer with charts derived from census table H-17 which you can and really should download here (the best way to keep us all honest is to play along at home).

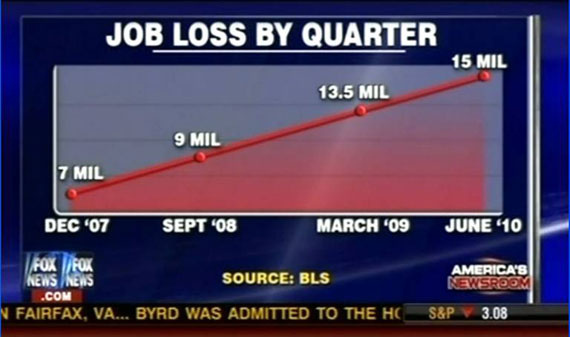
The trouble is they're bad graphs.


To the extent that statistics includes data visualization, this is definitely bad statistics. When trying to depict trends and relationships, you generally want to get as much of the pertinent information as possible into the same graph. You don't want to force the reader to jump around the page trying to estimate slopes and compare magnitudes, nor do you want to take a few snapshots when you can easily picture all the data.

There are lots of acceptable ways of laying out the data table H-17, but I'm going just going to go with the simplest (partly because I like simple and partly because I'm doing this on Openoffice). As with McArdle's graphs, the numbers are inflation-adjusted.


I'm not that comfortable with this data (for reasons I'll get to in a minute), but this does look fairly consistent with the hollowing out of the middle class with 35K-75K (the top two lines) dropping more or less steadily for decades. Also check out the more than fourfold increase of people making more than 150K,

The two main things that make me uncomfortable with the data are the start point (with falls close to at least a couple of inflection points) and, on a related note, the failure to account for the baby boom which was at the bottom of its earning power forty years ago and should be close to the maximum now.

As far as I can tell income distribution is not broken down by age in these tables (though I suspect the data are available on request). We can, however, answer the related question of what median income looks like when we control for age and extended over a longer interval. (Download table P8 from here)


You can see why I was nervous about starting in 1967.

The question of income inequality and what's happening to the middle class is a complicated one and is probably best addressed by people who know what they're talking about, but if you are going to try to argue one side of the case graphically, you should at least take the time to use appropriate graphs.

p.s. I picked 35-44 because it seemed like a good representative mid-career interval and because, since I wasn't comparing different age groups, an uncluttered one-line graph seemed sufficient. If you prefer, here's the multi-range version (though I don't know if it adds much information).


Tuesday, February 15, 2011

Monday, February 14, 2011

USA Today has some bad graphs but at least it's not the New York Times

The following quote was included in one of Andrew Gelman's recent posts:
Is this the worst infographic ever to appear in NYT? USA Today is not something to aspire to.
This strikes me as deeply unfair to USA Today. The paper has certainly run its share of bad graphs but these take things to a new level. It is as if the NYT used illustrations from "How to Lie with Statistics" as a starting point and then tried to top them.

Here's the "View of the U.S." where the lower the icon is, the higher its approval.


And here's the "U.S. Pakistan Policy" where the scrolls are arranged so you can't really compare their sizes (I initially thought they were going for some depth effect).

And here's the "Greatest Threat" which takes Huff's height/volume examples to the next level by using images of different shapes and densities.

Finally there's this amazing piece of work:

Just glancing at this you would probably conclude that the amount of blue in the circles corresponds to percentage in agreement. For example, looking at the middle circle you'd assume that almost all of those surveyed were in disagreement. You'd be wrong. More agreed than disagreed. (This was also noted by one of the commenters on Gelman's site.)

While they don't quite match this, these graphs may be the worst we've seen from a major paper in recent memory.


[adapted in part from a comment I left on Andrew Gelman's site]

Wednesday, June 30, 2010

How to REALLY lie with statistics

Darrell Huff had a witty explanation of how you can change the impression a graph gives by playing around with the scale and range of the y-axis, but even in a book called How to Lie with Statistics he never even considered changing just part of the scale of an axis. Of course, Huff was limited by the fact that his book was based on real statistical lies and screw-ups that he had found in the popular press as of the early Fifties. He also tried to limit himself to lies that were at least true in some technical sense. There was no way he could have anticipated Fox News.

The catch comes from Media Matters via Mark Thoma.


Here is the same graph with vertical lines for full comic effect.


Go ahead, measure them for yourself. It's fun.

In all fairness to Fox, the period from September '08 to March '09 did feel like a long time.